In a previous post, we argued that evaluations of acoustic gunshot detection (AGSD) systems or other technological solutions to crime must be guided by a well-developed logic model. The logic model gives evaluators and agencies a roadmap of how to conduct the evaluation, as well as a template through which to understand the results of a quantitative evaluation. In this post, we describe our recent efforts to evaluate AGSD in Wilmington, DE.

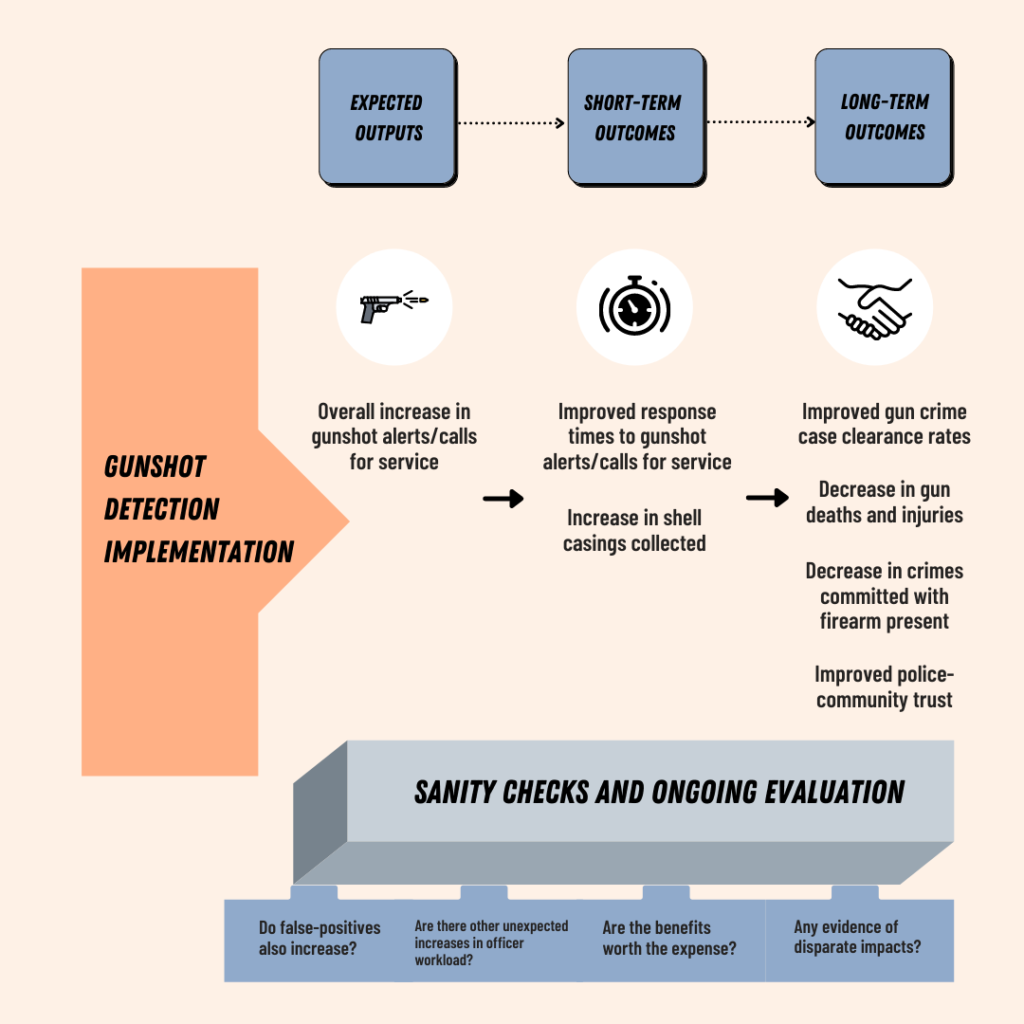
As a refresher, Figure 1 shows our generalized logic model used to evaluate the impact of AGSDs. This model demonstrates how we imagine expected outputs—namely, an overall increase in gunshot alerts—to produce short-term outcomes, such as improved response times, which then result in long-term changes that are socially relevant. We highlight how it is important to continually assess unexpected consequences of the system and ensure that the system functions in an equitable and cost-effective manner.
The National Police Foundation recently completed an evaluation of the implementation of an AGSD system in Wilmington, DE. The full evaluation included qualitative and quantitative components and featured a wide range of statistical techniques with a range of complexity. Note that we could not address all steps and analyses implied by our logic model; data limitations hindered our investigation of the full model. This is very likely to be the case in nearly any evaluation effort; however, we can show how this tool can amplify the usefulness of even an imperfect evaluation.
Expected Outputs
The most immediate expected output from implementation of any AGSD system is that the number of gunshot alerts/calls for service (CFS) should increase. This assumes that people are imperfect reporters of gunshots because either they are not present, awake, or conscious of them, or they are not motivated to report them. A fully implemented AGSD should have none of these difficulties and therefore result in additional alerts. Figure 2 shows the number of alerts over time, with a full-system implementation beginning in February 2020. Clearly, there is a large increase in the number of alerts after this date. The only statistical test needed for this is the interocular trauma test—it is so obvious that it hits you square in the face.
Figure 2: Time series for gun shot alerts (July 2014 – February 2021)
Having observed a clear increase in gun shot alerts, we can be reassured that the system is working in a way that could lead to improvements in short- and long-term outcomes.
Short-Term Outcomes
The increase in alerts is an immediate output of operating an AGSD system. These alerts are designed to tell law enforcement agencies when and where gunfire occurs with a level of precision and promptness that exceeds traditional reporting mechanisms. This precision and speed of notification should theoretically lead to faster response times and an increased ability to collect evidence.
Our team sought to evaluate these short-term outcomes but was unable to obtain data that would yield evidence for these impacts. With respect to evidence collected, our agency partners were unable to provide data on the number of ballistics or guns recovered, entered into NIBIN, traced through eTrace, or the number of witnesses identified. Data on response times were also incomplete and determined to be insufficiently reliable to further explore this outcome.
This is an unfortunate reality of doing evaluations with policing data. For many agencies, it will be difficult or impossible to provide reliable information. We will see later exactly how this influenced the conclusions of our work.
Long-Term Outcomes
Despite our inability to gain insight into short-term outcomes, we were more successful in evaluating a diverse set of long-term outcomes. Here, we focus on case clearance rates, rates of overall crime, homicides and shootings, and community attitudes. Figure 3 shows the longitudinal accumulation of homicide and shooting cases, and the simultaneous accumulation of clearances of these types of offenses, by arrest. This is yet another example where the visual nearly obviates the need for a statistical test. While cases keep climbing after full AGSD integration, case clearances remain almost flat. In fact, the probability of a shooting being cleared decreases in the post-implementation period.
Figure 3: Case clearance data (January 2019 – March 2021)
Looking at overall crimes and the subset of homicides and shootings, we see similar patterns that are the opposite of what we would expect. Figure 4 shows the time series of these outcomes, along with the count of AGSD alerts again. Using Bayesian structural time series models, we found that these events increased in the post-implementation period more than we would have expected. This pattern was particularly pronounced for shootings.
Figure 4: Time series of overall crimes, homicides, and ShotSpotter alerts, with the number of events aggregated at each month (January 2014 – June 2021)
We collected community perceptions through surveys administered at two different time points — before and after the full implementation of AGSD. Figure 5 shows an interactive table of the results of these surveys, where wave 1 was fielded 10 to 11 months before full AGSD implementation, and wave 2 was fielded 10 to 11 months after full AGSD implementation. These data were analyzed using a model that is analogous to a one-parameter item response theory model in a multilevel regression with a poststratification framework. The difference column represents the estimated shift between the two waves. Across all survey sections, only responses to questions about neighborhood concerns showed consistent improvements between waves, and even these tended to be very small in magnitude (around one to two- tenths of a point on a three-point scale).
Figure 5: Estimated change in community attitudes and perceptions between wave 1 and wave 2
Sanity Checks and Ongoing Evaluations
Given that there is negligible evidence that there was an overall positive impact of this AGSD implementation, there is less motivation to conduct additional analyses looking for unintended consequences. This does not necessarily mean that the system did not have undesirable side effects; however, if the system was not achieving its primary goal, then there is even less reason to believe that it had unintended consequences. However, evaluation of the overall impact may mask other more nuanced findings. For example, we may find differential impacts by places or neighborhoods. Such a finding, however, would hardly be a desirable property of an expensive technological system.
Conclusions
AGSD technology has increased the number of gunshot calls for service that must be addressed by the Wilmington Police Department. This is the minimum we would expect from an AGSD system that is turned on and functioning. We do not know whether this increase in gunshot calls for service correspond to the detection of previously unknown gunshots, if it is creating false alerts, or if both are true. Having access to short-term outcomes could tell us how efficiently the system is functioning. However, without access to these measures, we are missing a key link in the causal chain, which makes it more challenging to interpret downstream observations. For instance, we know that the ultimate long-term outcomes that we care about (e.g., murders, shootings, case clearances, and community attitudes) were largely unchanged, or moved in the wrong direction. Should we believe that these observations occurred because the AGSD system did not improve response times and/or evidence collection, or because improving the response times and evidence collection was not a good way to improve overall long-term outcomes? Without the intermediary metrics, we cannot say. This evaluation shows that effective technology evaluations require additional complete data.


